October 22, 2014 •Brian Watson

 Rising treatment costs and an increase in patient self-pay receipts are gradually shifting the revenue landscape for many healthcare organizations.
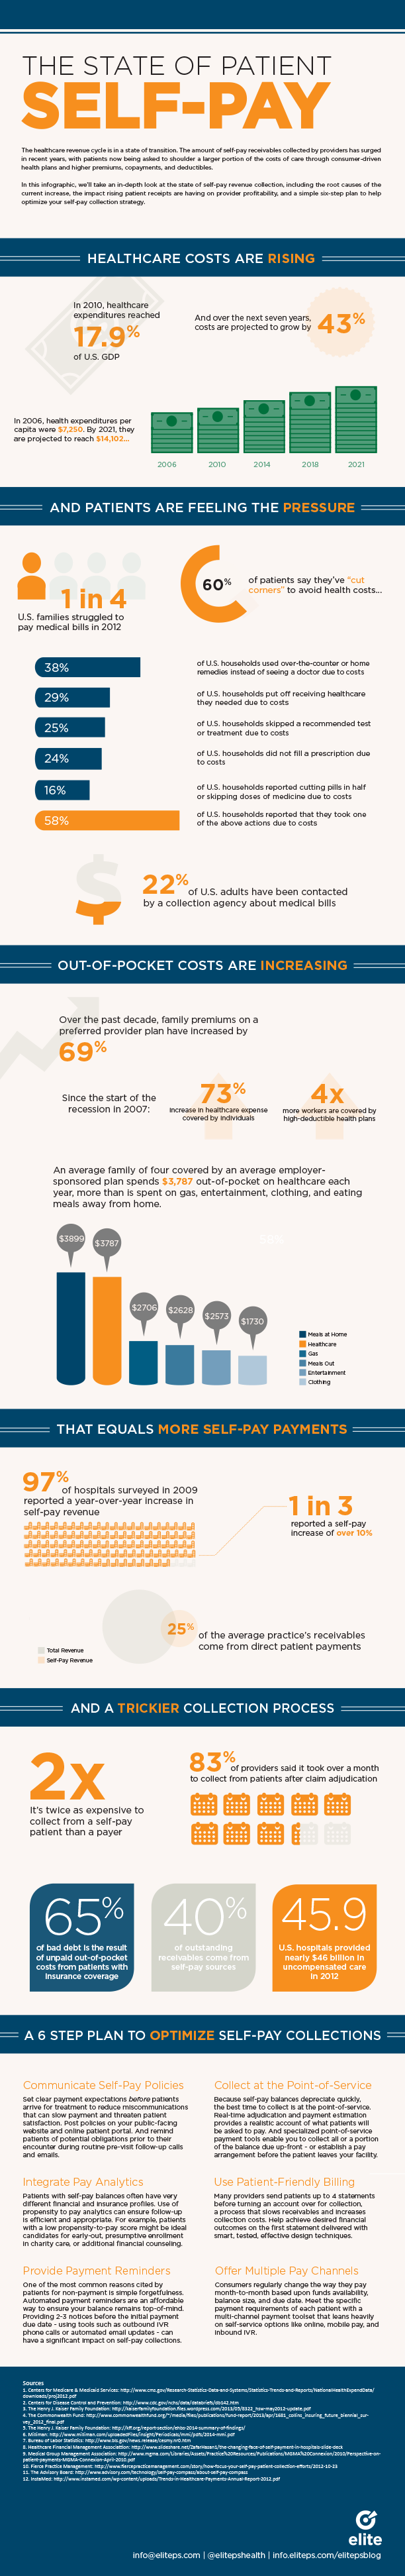
Healthcare expenditures reached 18% of U.S. GDP in 2012 – a 26% increase since 2006. And spending is projected to account for a full one fifth of the economy within the next decade.
Facing escalating insurance premiums (up 80% since 2003) and an economy still in the midst of tenuous recovery, employers are increasingly asking patients to shoulder a larger portion of the costs of care through higher premiums, copayments, and deductibles and consumer-driven health plans.
For example: over the past decade, the average premium for a family on a preferred provider plan have increased by 69%. Expenses covered by individuals – through payroll deductions and out-of-pocket costs – have increased 73% (an average of 8% per year) since the beginning of the recession in 2007.
If a higher portion of direct patient payments doesn’t exactly have you jumping for joy, you’re definitely not alone. Self-pay revenue collection is often fraught with productivity roadblocks.
It’s more costly, more time consuming, and less likely to result in a preferred payment outcome. Collecting from patients directly can cost twice as much as being reimbursed by a payer. Not to mention subpar patient statement processing and aggressive collection tactics can alienate patients and put valuable, long-term treatment relationships in jeopardy.
In our latest infographic, we’ve taken an in-depth look at the state of self-pay revenue collection. Check it out below to learn the root causes of the current increase, the impact rising patient receipts are having on provider profitability, and a simple six-step plan to help optimize your self-pay collection strategy.